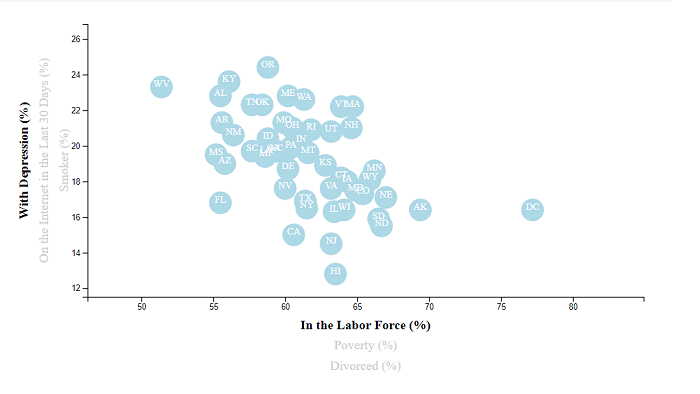
Question: "Is there a correlation between certain demographic groups and their risk for specific behavior or health traits?"
A dynamic scatterplot was created using JavaScript and D3 to show correlations between 2014 survey data of U.S. demographics and behavioral risk factors.
Link to code here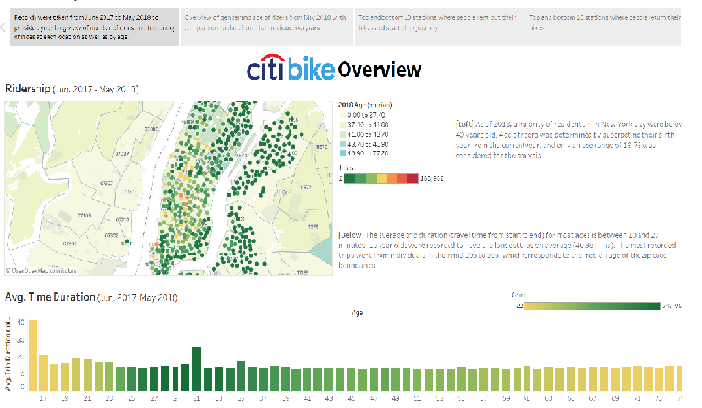
Question: "How has the NYC Citi program changed in number of stations, customers, and location visitation frequency over that last few years?"
The NYC Citi Bike program is a bike share program that allows visitors to conveniently travel around the city at an affordable price. Customer and bike station data was selected and cleaned using Excel and visualized on Tableau.
Link to code here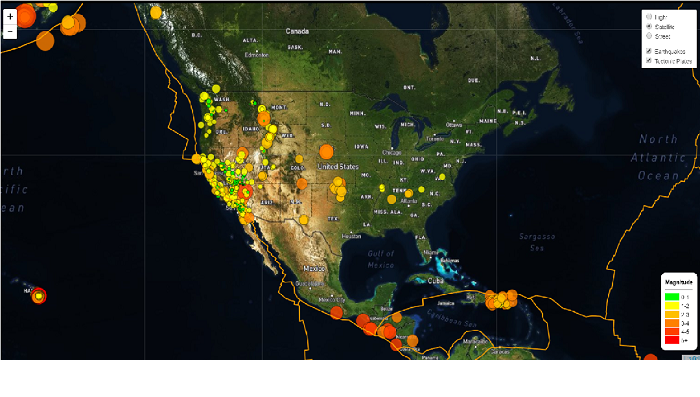
Question: "How can we map the location and magnitude of recorded earthquakes from the last week?"
A map of USGS earthquake GeoJSON data from the last 7 days was created using JavaScript and the Leaflet library.
Link to code here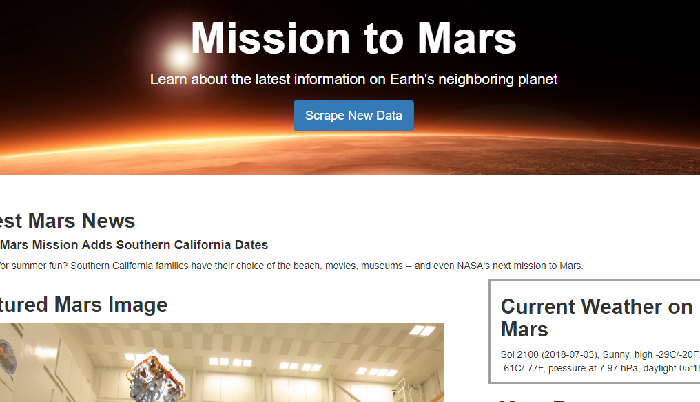
Question: "How can we retrieve current Mars news, temperature, and facts from various online sources?"
Web scraping of various URLs using BeautifulSoup, Splinter, and Pandas. MongoDB with Flask templating was used to generate an HTML to display scraped information.
Link to code here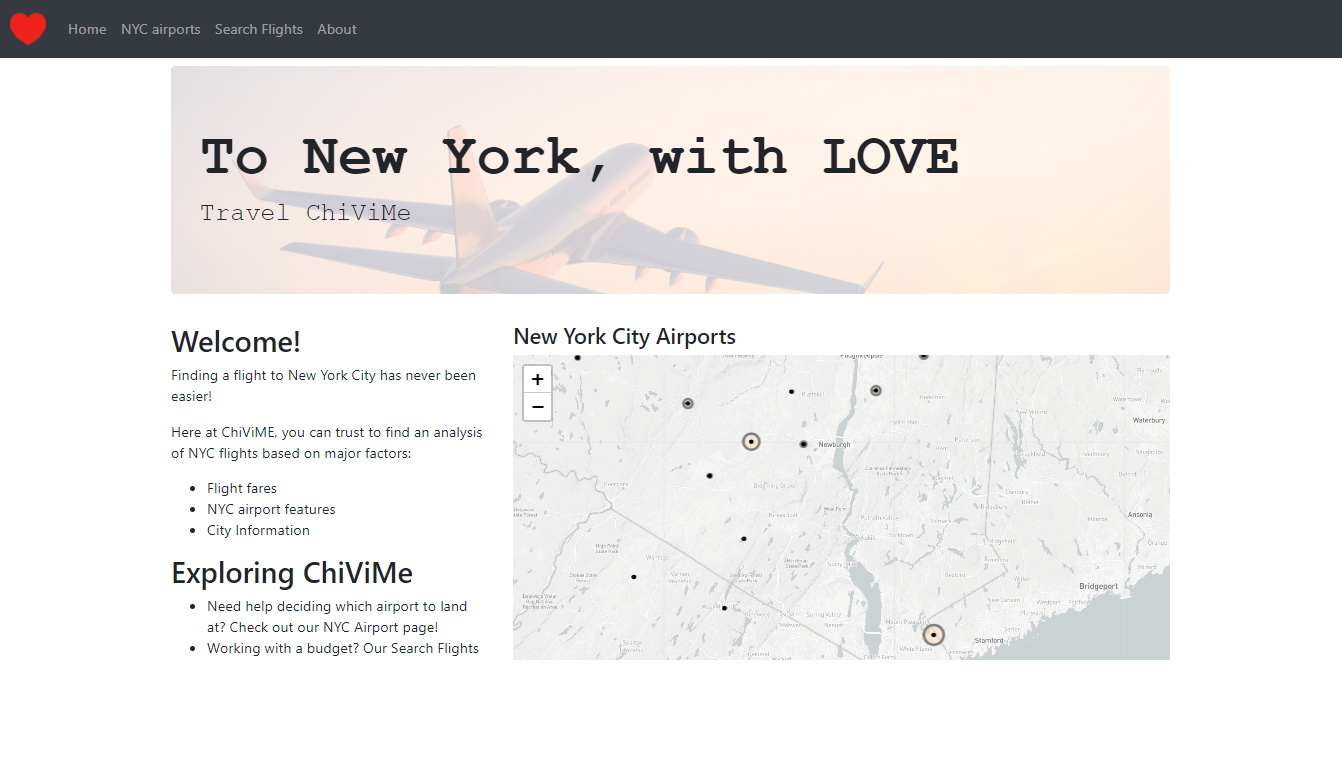
Questions: "Which airport should I land at when I'm visiting the New York City area?"
A Python Flask app was connected to a MongoDB database that stored cleaned airport information. The Amadeus API was used to retrieve current fares for various flight options. Visualizations were created using Leaflet, Plotly, and Tableau. The app was deployed on Heroku and can be viewed at https://nyc-air.herokuapp.com/.
Link to code here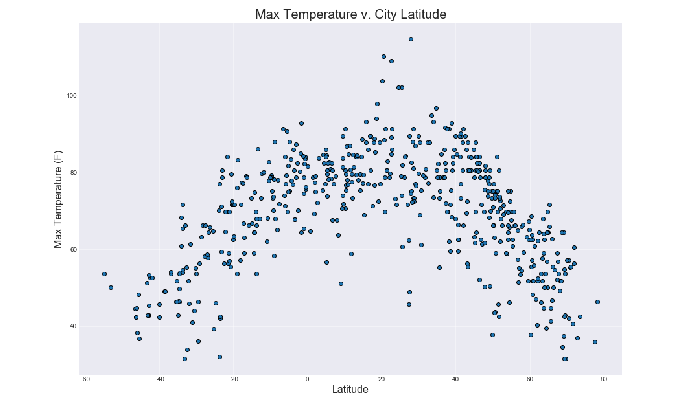
Question: "Are there trends between a city's latitude and its recorded temperature, humidity, cloudiness, and wind speed?"
Python and the OpenWeatherMap API was used to generate random cities around the world and related weather data. Matplotlib and seaborn was used to visualize the information.
Link to code hereI am a data-driven and highly motivated Data Analyst. Dedicated to perfecting my skills and practicing analytical and visualization tools, such as Python, HTML/CSS, JavaScript, SQL, MongoDB, D3.js, Tableau, and Hadoop. Experience with collecting, cleaning, and analyzing data that transforms into relevant stories using the best available tools.
I graduated Temple University with a Bachelor's degree in biology and criminal justice in 2017. Currently, I reside in the New York/New Jersey area and studying data analytics and visualization in the Data Science Program at Rutgers University. My academic background has developed my ability to critically examine problems and logically process information and conclusions.